


Meeting of the Board of Regents | June 2009
|
|
THE STATE EDUCATION DEPARTMENT / THE UNIVERSITY OF THE STATE OF NEW YORK / ALBANY, NY 12234 |


|
TO: |
Audit Committee and Subcommittee on State Aid |
|
FROM: |
Johanna Duncan-Poitier |
|
SUBJECT: |
A Review of School District Financial Condition
|
|
DATE: |
June 10, 2009
|
|
STRATEGIC GOAL: |
1, 2, 3 and 5
|
|
AUTHORIZATION(S): |
|
SUMMARY
Issue for Discussion
Review and discussion of the conditions in fiscally-stressed school districts.
Reason(s) for Consideration
For information
Proposed Handling
This item will come before a joint meeting of the Regents Audit Committee and State Aid Subcommittee at the June 2009 Regents meeting.
Procedural History
The Regents Audit Committee reviews the condition of fiscally-stressed school districts each year. The State Aid subcommittee evaluates the needs of school districts for funding needed to support an adequate education.
Background Information
The ability of New York State school districts to maintain the financial condition necessary to support continuous educational programs that allow all students to have the opportunity to achieve State learning standards has long been a Regents public policy concern. In addition to the work of the Audit Committee and State Aid Subcommittee, the Department provides support to strengthen school district and BOCES financial condition by providing technical assistance in business operations and internal controls, oversight of required school board member training in fiscal accountability, and through development of and commenting on pertinent legislation.
Recommendation
N/A
Timetable for Implementation
N/A
School District Financial Condition
Adequacy, Stress and Academic Performance
The Regents Annual Report to the Legislature and Governor on the Educational Status of the State’s Schools (Chapter 655 Report) has cited numerous examples of improvement in student achievement since 1996 when the Regents began to raise standards for all grade levels and imposed graduation requirements aligned with the new standards. While there have been many positive changes in the last 18 years since the Regents have reported on the educational progress of the State’s schools, one disturbing aspect of the report has remained the same. The report continues to document a pattern of high student need, limited resources, and poor performance in many districts. Generally, these districts can be described as having high student needs relative to their capacity to raise revenues. These high need districts include the Big 5, 46 smaller districts with many of the characteristics of the Big 5, and 156 rural districts. Large gaps in performance exist between these high need districts and low-need districts, which serve children from more affluent families and have generous local resources to draw on.
The Regents proposal on State Aid to school districts has pursued three Regents goals: to close the gap between actual and desired student achievement; to ensure that public education resources are adequate; and that school districts use these resources effectively and efficiently. The Foundation Aid formula enacted by the Legislature and Governor in 2007 holds promise for addressing the resource and achievement gap reported in the Chapter 655 Report by providing adequate funding to give all students the opportunity to meet State learning standards. To the extent that funding is not adequate and districts suffer from fiscal stress, the State will make less progress in closing student achievement gaps.
This paper examines school district fiscal stress and the conditions that occur in fiscally stressed school districts. It finds that the State Foundation Aid formula will help to reduce stress in school districts that suffer from inadequate funding and fiscal stress. It finds that a large portion of fiscal stress can be reduced through effective management strategies and reports on practices that contribute to good financial condition of school districts. See Appendix I for a list of the principles that support sound school district financial management.
Why is School District Financial Condition Important?
There are many reasons to be concerned about the fiscal condition of school districts. A healthy school district financial condition:
- Provides stability and continuity of operations;
- Ensures resources are available to close achievement gaps and help students meet state learning standards;
- Maintains credibility with taxpayers;
- Helps to recruit and retain staff;
- Helps to ensure cash is available to pay bills;
- Provides continued access to financial markets; and
- Gauges fiscal stress.
This report provides an example of a district that experienced significant fiscal stress. It then provides an analysis of 50 school districts that experienced some level of stress and examines factors that contribute to this. In both analyses, implications for student achievement and graduation rates are discussed.
A Case Study of a District in Fiscal Stress
Figure 1 demonstrates the importance of diverting fiscal stress before it occurs. It shows change over time in two financial measures we will pay much attention to in this discussion: surpluses and fund balances. It reflects the actual five year fiscal experience of a small city district with high student needs in relation to resource capacity. The district implemented reforms to increase high school completion, ignored signs of fiscal stress and in a few years went from a situation of having a healthy fund balance to a serious deficit. The lesson learned is that districts need to engage in positive, affirmative behaviors on a regular basis to change a worsening fiscal condition early.
This district was intent on making significant academic achievement and they did so. Figure 2 shows that over the period from 1999-00 to 2007-08 the attainment of Regents diplomas increased from 42 to 78 percent. However, the district’s spending during the middle of the series in the late 1990s, began to outpace its general fund revenues, as Figure 3 indicates.
This budget gap had widened significantly by 2001-02. At this point the budget gap – the difference between spending and revenues - was 13 percent. In 2002-03 the district sought and received deficit financing. While this budget gap was widening, and State aid was growing, local revenues, which could have helped to fill the shortfall, were essentially flat, as Figure 4 shows in the series at the bottom. And in real terms, that is, after adjusting for inflation, local revenues shrank. What these graphics illustrate is the delicate tension between making necessary expenditures to yield achievement gains and maintaining a sound financial condition which can preserve the instructional program’s integrity, longer-term.
Analysis of School Districts with Fiscal Stress
In Figure 5 we list 16 districts that according to the Department’s measure of the fiscal health of the district, are those that we have labeled as in ‘Stress’ during the last three years. Several of these districts’ financial condition was also of ‘Concern’ during this period, a lesser threshold than ‘Stress’. Appendix II details those factors that determine whether a district falls into one of these categories. Accordingly, these districts are those for whom we have examined very closely, the taxing, spending and other financial behavior, so as to prevent further financial difficulty and remediate the conditions leading to stress.
There are an additional 34 districts that experienced ‘Concern’ from school year 2005-06 to the present. In the case of these districts their financial problems appear to be more of a one-time phenomenon and not persistent. Overall the average three-year surplus as a percentage of the budget, for these 50 districts, is 2.7 percent. We may think of this metric as an operating margin, to provide a cushion in bad economic times. In the ensuing four charts we will display data in charts which operationalize the concept of fiscal stress or condition by this measure of three-year average surplus (or deficit, whichever is applicable) as a percentage of budget.
Figure 5 shows that overall, the number of districts in stress or of concern has declined by about half by the third year, relative to the first year in the series: from forty-one to twenty. However, it would be premature to conclude that financial difficulty is overall in decline or that it is a problem under control. This period under analysis reflects a robust one in terms of property and income growth statewide, as well as large increases in State aid. Furthermore, because of lags in the financial data used as inputs to State aid, this series does not reflect the effects of the current recession. Therefore, we should not be surprised if the number of stressed/concerned districts rises in the near future.
Figure 5 also shows that nine of these 16 fiscally stressed school districts are high need school districts, six are average need and one is low need. Figure 5 presents the level of proficiency at elementary and middle school levels and the percent of the cohort that is graduating from these districts. The high need school districts tended to have poorer elementary/middle school proficiency (an average of 74 percent versus 81 percent) and lower graduation rate (an average of 76 percent versus 88 percent) than the average and low need fiscally stressed districts. Thus, fiscal stress can affect high, average and low need school districts. It is more likely to be associated with poor academic performance of students in high need school districts.
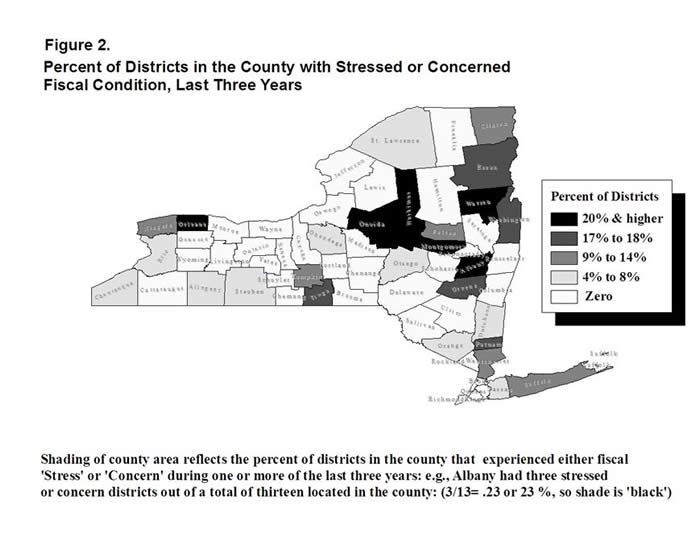
Another finding that should be of interest is the extent to which certain counties and regions are over- (and conversely under-) represented in the class of districts that are in stress or of concern. We display this regional geographic effect in the State map contained in Figure 6. In it, we shade each county by the share or percentage of its districts that are in stress or concern. The greater the percentage of stressed or concerned districts, the darker the shade (where counties in white reflect those that experienced no districts in stress or concern). For example, a county shaded black, if it had five school districts, would have at least one (or twenty percent) of its districts in stress or of concern.
Thus, seven counties in black had more than one-fifth (20 percent) of districts so affected. They are: Orleans, Oneida, Herkimer, Montgomery, Warren and Albany. ‘Eyeballing’ this map it suggests that there is a regional effect or clustering underway.
The North Country, Central and Western New York and Hudson Valley regions are experiencing a greater propensity of districts to experience stress. Therefore, it would be useful to examine if underlying economic factors explain or correlate with district surpluses. We turn our attention to this question in Figures 6 and 7.
In Figure 7 we examine whether such economic variables as district poverty and median income are related to school district budget surpluses. Indeed they are. The relationships are as we would have expected. High surplus districts are less poor and have greater incomes. School districts with a three-year average surplus of five percent or greater have 23 percent of pupils eligible for the free and reduced price lunch program. This is half as large as that of deficit districts which had a three-year average deficit of zero or less and a 47 percent incidence of pupils eligible for reduced-price lunches. High poverty districts tend to have greater demand for educational services and limited resources to pay for those services. As such it is not surprising that these districts are more likely to have operating deficits. Moreover, deficit districts have reduced fiscal capacity with median incomes about one-third less than high surplus districts.
6
Similar and expected results are revealed by the findings in Figure 8. That is, deficit districts have a local revenue per pupil value less than half that of high surplus districts. From this we would conclude that deficit and lower surplus districts because of their poverty and lack of wealth are less able to raise local revenues to support education.
The variables in Figures 7 and 8 are the few examples where we found statistically significant relationships or correlations between economic variables and surpluses for these 50 districts. However, the best simple model of these independent variables only explains 20 percent of the variation in school district surpluses. (The actual relationship using more sophisticated statistical techniques might prove to be different. This would be an area we would recommend for further research.) This suggests that lower incomes and property values explain about one-fifth of school district fiscal stress, and that the balance--80 percent—is not explained. These can be attributed to factors under the control of the district over which they have discretion, namely their management practices related to taxing, spending and investing. We conclude that it is more accurate to think of ‘fiscal stress’ as not a pre-determined outcome driven solely by economic factors outside the district’s control. The conclusion lists some principles of sound fiscal management that can guide school district behavior in this regard.
The Foundation Formula, because of its strong targeting or distributive effects for pupil poverty and the extent to which it captures changes in district wealth and fiscal capacity--reflected in income and property value changes--should reduce the likelihood of a district falling into stress, when fully phased in.
Finally, we were interested in examining whether there is a relationship between fiscal condition and achievement. This is important because achievement is the ultimate goal of an education system. That is poor district financial condition in and of itself, is of concern, but it is of obviously greater concern if it is accompanied by, or leads to poor achievement results.
When we examine the data displayed in Figure 9, we find a slight difference in performance for high surplus districts. However, the difference is small: less than seven percentage points separates deficit and high surplus districts on this achievement metric and statistical tests reveal that these mean differences are not statistically significant. However, the analytical framework in the chart is a static one – it reflects the achievement results of a single year, school year 2007-08. Over the longer term, we would be hard pressed to conclude that fiscal condition is a factor that has no bearing on achievement. A district with continued fiscal stress may lack the resources and the management wherewithal to make the correct investments needed to yield performance gains and get the best bang for the buck.
 Moreover, we can only imply causation from correlation and thus cannot say with assurance that stress causes poor achievement. We also have no simple way of discerning whether the relationship between achievement and fiscal condition is one in which causation moves in one direction or whether it is a more complex one with feedback loops. That is to say, surpluses cause high achievement and vice versa. For example, the ability of a district to manage its finances drives achievement by causing wise investment of financial resources. Alternatively, a high performing district is likely to be one that homebuyers will flock to, thereby, providing it with the necessary fiscal capacity to fund educational services. Thus it would be unwise to take away from this figure the conclusion that because it reveals a slight or negligible relationship between surpluses and achievement that it does not matter whether districts fund education adequately.
Next we turn our attention to fund balances. Research by Boyd, Lankford and Wyckoff (2002) showed that in periods of generalized economic troubles in the State, from 1989 to 1994, a period during which both New York and the nation as a whole experienced recessions, downstate suburban districts that ran high fund balances were able to smooth out the effects of a poor fiscal climate without reducing spending on instruction or increasing their local levy as significantly as medium and smaller-sized fund balance districts. We wanted to see if a similar phenomenon resulted during a downturn in more recent years.
Therefore, we examined data on local revenues, instructional expenses and fund balances during the years 2000 to 2003, a period where once again New York was in recession and keeping with the general trend, its duration was longer than that of the nation as whole. We examined these three variables for school districts with low, medium and high fund balances.
As Figure 10 indicates, high and medium fund balance districts were able to minimize the annual increase in local tax effort as measured by average annual change in levy per pupil, relative to those with low fund balance. Low fund balance districts had a rate of change in levy per pupil over this period more than double that of medium and high fund balance districts. This is what we would have expected and it replicates the findings of Boyd, Lankford and Wyckoff.
With regard to spending on instruction, the findings are similar. Overall, as was the case with local revenue efforts displayed in Figure 10, Figure 11 suggests that high fund balances do appear to provide a greater ‘cushion’ and smoothing effect. This allows these districts to continue to make greater annual change in investing in instruction during a downturn, without imposing as large a levy increase. For example, high fund balance districts were able to raise instructional spending by almost 9 percent (8.9), while only increasing tax levy on average, by less than three percent (2.7), a leveraging ratio of 3:1. For low fund balance districts, this ratio was closer to 1:1. That is, in order to raise instructional spending by 7.8 percent they raised local tax revenue by 7.4 percent on average annually. Consistent spending on instructional programs over time is expected to help support education reforms and student achievement growth.
Conclusion
This paper reviews a case study of a district that experienced fiscal stress and summarizes data related to 50 school districts that showed signs of fiscal stress or concern over a three-year period. It finds that approximately 20 percent of the difference in the financial condition of school districts can be explained by factors outside the control of school districts such as student poverty and changes in resident income and property value. The negative impact of these factors will be reduced by a fully phased in State Foundation Aid formula. The balance of factors that influence financial condition can be attributed to management strategies and skills within the control of school districts. These involve:
- Establishing internal controls that reduce risk and increase the likelihood that the school district can accomplish its mission;
- Setting the proper ‘tone at the top’ by the board of education and superintendent; and
- Periodic reviews by staff, an Audit Committee and the full board of education of the school district budget to ensure that expenditures stay within available revenues.
In addition the following strategies will help to promote fiscal stability:
- Use data to drive fiscal change
- Develop a five-year financial plan
- Have a systematic approach to budget development
- Ensure timely budget administration
- Educate the school board and community
- Manage the fund balance
- Maximize revenues
- Find cost-efficiencies
- Minimize the negative impact on cuts
In summary, while fiscal stress may not have an immediate impact on student achievement and graduation rates, over time, poor financial condition and management is likely to threaten districts’ efforts to close achievement gaps and raise achievement. High need school districts are more likely to experience stress and the Regents foundation aid proposal will go a long way toward reducing fiscal stress. Internal controls and financial management strategies can effectively reduce much of the stress that districts experience.
Appendix I
Principles of Sound School District Financial Management
A district is in sound financial condition if:
It has enough cash on hand to pay current bills and those that are due shortly.
It has sufficient revenues to support expenditures on an ongoing basis with minimum reliance on the district’s savings/fund equity.
It can meet long-term debt obligations and maintain a good credit rating.
It can provide education services at a level that meets the needs of all students demonstrated by student results that meet or exceed State standards.
Its administrative staff has demonstrated a commitment to professional development and continuing education.
Its long-range fiscal plan is compared frequently to actual progress and adjusted to meet dynamic environmental conditions.
It maintains its buildings in a condition to avoid unexpected major renovation costs.
It files all state and federal aid claims in a timely and accurate manner, to avoid few or no major post-filing adjustments.
It engages an experienced auditing firm that encourages business office staff to
discuss changes in school district accounting requirements as they arise, throughout the year.
Frequent interaction occurs between the board of education and the administration relating to discussions of the district’s fiscal status and trends.
Appendix II
Factors ‘Triggering’ a Designation by SED Audit Services of a District as in Fiscal Stress or Concern
High Risk (i.e., ‘Fiscal Stress’)
- A negative fund balance
- Unreserved, undesignated fund balance is negative and the total fund balance is less than two percent of the adopted budget.
Medium Risk (‘Fiscal Concern’)
- Fund balance less than 2 percent of adopted budget
- Cumulative operating deficit of less than 6 percent of the adopted budget and a fund balance of less than five percent of the adopted budget
High surplus districts are those with a three-year average surplus as a share of budget of 5 percent or greater; low surplus districts have an applicable surplus rate of les than five but greater than zero percent; and deficit districts have a surplus of zero or less.
Boyd, D., Lankford, H. and Wyckoff, J. School District Expenditures and Fiscal Stress, available at: http://www.albany.edu/edfin/year3.html
New York State Division of the Budget, 2009-10 Executive Budget – Revenue and Economic Outlook, available at: http://www.budget.state.ny.us/pubs/0910_budgetPublicationsAll.html
From New York State Education Department, Fiscal Fitness: A Guide to Monitoring Your School District’s Budget, http://www.emsc.nysed.gov/mgtserv/FiscalFitnessGuide.htm