Meeting of the Board of Regents | December 2007
|
|
THE STATE EDUCATION DEPARTMENT / THE UNIVERSITY OF THE STATE OF NEW YORK / ALBANY, NY 12234 |
|
TO: |
The Honorable the Members of the Board of Regents
|
|
FROM: |
Alan Ray and David Abrams
|
|
SUBJECT: |
NAEP and State Testing
|
|
DATE: |
December 4, 2007
|
|
STRATEGIC GOAL: |
Goal 1
|
|
AUTHORIZATION(S): |
|
Issue for Discussion
Results from the National Assessment of Educational Progress (NAEP) as compared with New York State tests
Reason for Consideration
Results for the 2007 National Assessment of Educational Progress were announced in October and created instant controversy because of comparisons made with state tests across the country. The following is a comparison of the NAEP 4th and 8th grade reading and math test results with the New York State 4th and 8th grade tests.
Proposed Handling
For information
Comparing NAEP and the New York State Test Results
Results for the 2007 National Assessment of Educational Progress were announced in October and created instant controversy because of comparisons made with state tests. The following is a comparison of the NAEP 4th and 8th grade reading and math test results with the New York State 4th and 8th grade tests.
Key questions:
How do the tests compare?
-
Has New York improved on NAEP? How does that compare to improvement on the State tests?
-
How does New York’s improvement on NAEP stack up against improvement in other states?
-
How do
New York
’s scores overall compare to other states?
How do the tests compare?
Comparisons:
Who takes the tests?
- NAEP started to give 4th and 8th grade state-level tests and results in 1992. NAEP is given to a sample of between 4,000 and 5,000 students at each grade level.
- New York began to give the current 4th and 8th grade tests in 1999, when the Board of Regents raised standards. Before then, New York had much lower-level tests. The State tests are given to over 200,000 students at each grade level.
What do they test?
- NAEP: reading and math.
- State tests: reading, writing, and listening; plus math.
What stakes are attached?
- The NAEP assessment does not produce individual student scores: students take only a small portion of the entire test. NAEP results are not given back to any student. There are no consequences for schools, teachers, or students.
Since the early Nineties, some scholars have produced research that indicates students may not perform as well on NAEP as they are capable of doing because it is a low stakes test. Others disagree.1
- State test results are given to every student; schools are required to provide students extra help if they do poorly. Teachers, schools, parents and students view the tests as important. They figure prominently in School Report Cards and determine whether a school is considered in need of improvement.
What are the achievement levels?
- NAEP uses Advanced (superior performance), Proficient (solid academic performance), Basic (partial mastery), and Below Basic. The NAEP achievement levels have caused controversy. A panel convened by the National Academy of Sciences studied the science achievement levels and concluded that “NAEP's current achievement level setting procedures remain fundamentally flawed. The judgment tasks are difficult and confusing; raters’ judgments of different item types are internally inconsistent; appropriate validity evidence for the cut scores is lacking; and the process has produced unreasonable results.”
The National Center for Educational Statistics, which hosts the NAEP website, says, “A proven alternative to the current process has not yet been identified. NCES and the [National Assessment Governing] Board continue to call on the research community to assist in finding ways to improve standard setting for reporting NAEP results. The NAS Panel accepted the continuing use of achievement levels in reporting NAEP results on a developmental basis, until such time as better procedures can be developed.”
The NCES also says, “As provided by law, the Commissioner of Education Statistics has determined that the achievement levels are to be used on a trial basis and should be interpreted and used with caution. However, both the Acting Commissioner and the Board believe these performance standards are useful for understanding trends in student achievement.”
- State tests use Level 4 (Meets Standards with Distinction), Level 3 (Meets Standards), Level 2 (Partially Meets Standards), Level 1 (Not Meeting Standards). NYS uses the “Bookmarking” Standard-Setting Method for its testing program and this process was externally peer reviewed and approved by the U.S. Department of Education for the current grade 3-8 testing program. NYS also works closely with its external, independent Technical Advisory Group to ensure that the program adheres to the Joint Standards for Educational and Psychological Testing that are required by the American Educational Research Association, the American Psychological Association, and the National Council on Measurement in Education. NYS also incorporates best practices for test development, standard-setting, and test validation.
Cautions from the National Assessment Governing Board
- NAEP “can be used as evidence to confirm the general trend of state test results….”
- But “confirmation should not be conducted on a ‘point by point’ basis or construed as a strict ‘validation’ of the state’s test results.”
- Limitations in using NAEP to confirm State test results include “content coverage in the subjects,…student motivation in taking the state test versus taking NAEP,” and others.
Has New York improved on NAEP?
How does that compare to improvement on the State tests?
Since the late Nineties when the Regents raised standards and introduced the 4th and 8th grade tests, New York has improved on NAEP 4th grade reading and math and 8th grade math but not on 8th grade reading.
The tables on the left below show the change in the number of New York State students scoring at Basic and above on the NAEP tests. For comparison, the tables on the right show the change in the number of students scoring at Levels 3 and 4 on the State tests.
|
New York NAEP Results |
State Test Results |
|||||||||||||||||||||||||||||||||||||||||||||
|
New York NAEP 4th Grade Reading
|
4th Grade English
|
|||||||||||||||||||||||||||||||||||||||||||||
|
New York NAEP 4th Grade Math
|
4th Grade Math
|
|||||||||||||||||||||||||||||||||||||||||||||
|
New York
|
8th Grade Math
|
|||||||||||||||||||||||||||||||||||||||||||||
|
New York
|
8h Grade English
|
|||||||||||||||||||||||||||||||||||||||||||||
The number of New York State students who are Proficient and above has improved modestly on the NAEP tests:
New York 4th Grade Reading
|
|
|
||
|
|
1998 |
2005 |
2007 |
|
Black |
8 |
17 |
17 |
|
Hispanic |
7 |
17 |
18 |
|
Total |
29 |
33 |
36 |
New York
4th Grade Math
|
|
Percent Proficient and Above |
||
|
|
2000 |
2005 |
2007 |
|
Black |
5 |
13 |
18 |
|
Hispanic |
6 |
17 |
25 |
|
Total |
21 |
36 |
43 |
New York
8th Grade Math
|
|
Percent Proficient and Above |
||
|
|
2000 |
2005 |
2007 |
|
Black |
8 |
11 |
10 |
|
Hispanic |
10 |
14 |
15 |
|
Total |
24 |
31 |
30 |
New York
8th Grade Reading
|
|
Percent Proficient and Above |
||
|
|
1998 |
2005 |
2007 |
|
Black |
10 |
11 |
14 |
|
Hispanic |
10 |
16 |
16 |
|
Total |
32 |
33 |
32 |
How does New York’s improvement on NAEP stack up against improvement in other states?
Since 1998, when the Regents raised standards:
NAEP 4th grade reading: New York ranks 5th (in a tie) in improvement among Black and Hispanic students.
NAEP 4th grade math: New York ranks 3rd (also tied) in improvement among Hispanic students and 22nd in improvement among Black students.
NAEP 8th grade math: New York ranks 5th (multi-state tie) in improvement among Hispanic students and 21st in improvement among Black students.
NAEP 8th grade reading: New York had no improvement in the performance of Black and Hispanic students.
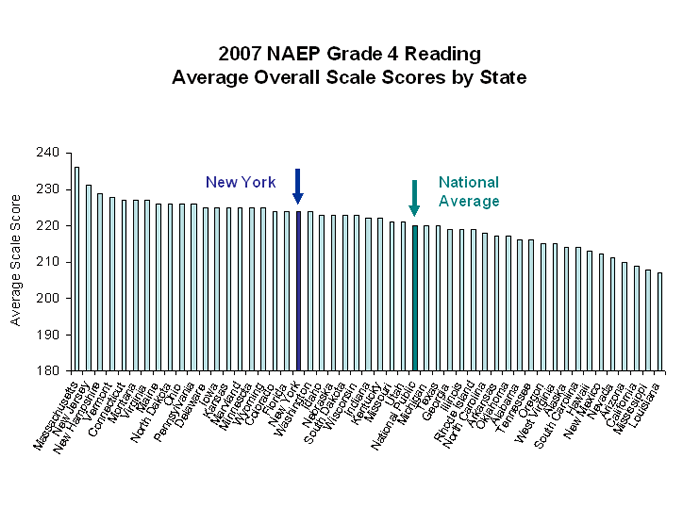
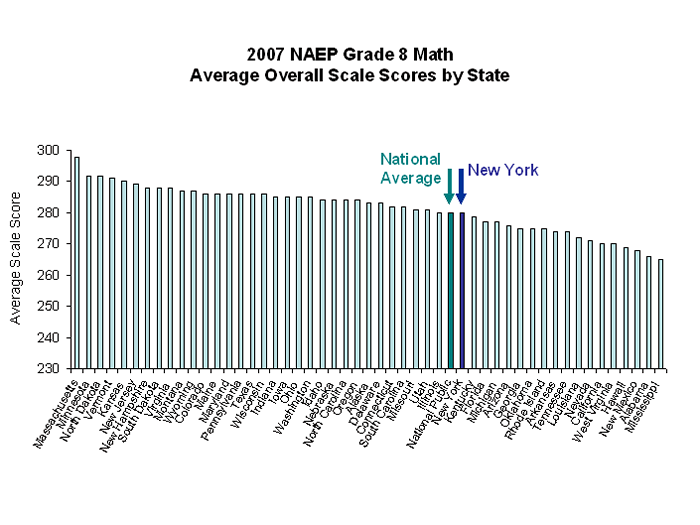
How do New York’s NAEP scores overall compare to other states?
New York is above the national average in grade 4 reading and math and in grade 8 reading and at the national average in grade 8 math. The National Center for Education Statistics cautions that the differences in scale scores are not necessarily statistically significant.


![]()

1 A study of grade 8 students concluded that “student effort can be increased by financial rewards offered at the time of test taking, and that such effort can result in an increase in NAEP math test scores. Thus, from a policy perspective, scores from low-stakes tests may not represent what the student knows. Rather, such scores represent what students will demonstrate with minimal effort.” O’Neill, Harold, et al, “Effects of Motivational Interventions on the National Assessment of Educational Progress Mathematics Performance,” Educational Assessment, 1995-1996. However, V. L. Kiplinger and Robert Linn found minimal impact because of the low stakes involved. See “Raising the Stakes of Test Administration: The Impact on Student Performance on NAEP,” 1992, Paper presented at the annual meeting of the American Educational Research Association.


