|
THE STATE
EDUCATION DEPARTMENT / THE UNIVERSITY
OF THE STATE OF NEW YORK / ALBANY, NY 12234 |
|
TO: |
The Honorable the Members of the Board of Regents |
|
FROM: |
Rebecca H. Cort James A. Kadamus |
|
COMMITTEE: |
Subcommittee on State Aid |
|
TITLE OF
ITEM: |
Special Education Funding Regents 2005-06 State Aid Proposal Development |
|
DATE OF
SUBMISSION: |
May 3, 2004 |
|
PROPOSED
HANDLING: |
Discussion |
|
RATIONALE FOR
ITEM: |
Policy Development |
|
STRATEGIC
GOAL: |
Goals 1 and 5 |
|
AUTHORIZATION(S): |
|
SUMMARY:
Attached are materials for discussion at the May meeting of the Subcommittee on State Aid. This meeting begins deliberations relating to the development of the 2005-06 Regents proposal on State Aid to school districts with a discussion on special education funding. Materials include:
· Attachment A is a discussion paper on providing financial support to help students with disabilities meet State learning standards. We refer you especially to the discussion questions on page 8, which are planned for public forums around the State this September. Members of the Board of Regents are invited to attend these sessions. Please notify David Johnson if you expect to attend.
· Attachment B presents a table on special education funding systems of each state in the nation prepared by Education Week as part of its 2003 annual state policy survey.
· Attachment C presents a schedule of reports for the development of the Regents State Aid proposal for 2005-06, for review and comment by Subcommittee members.
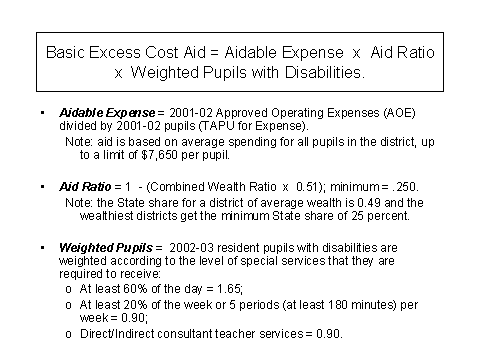
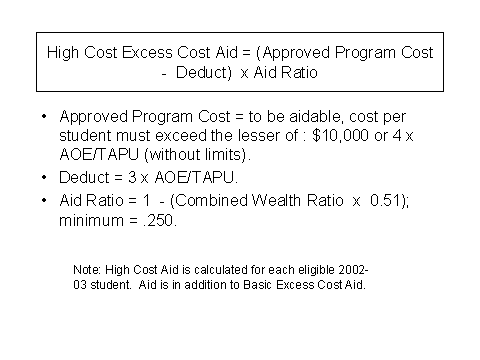
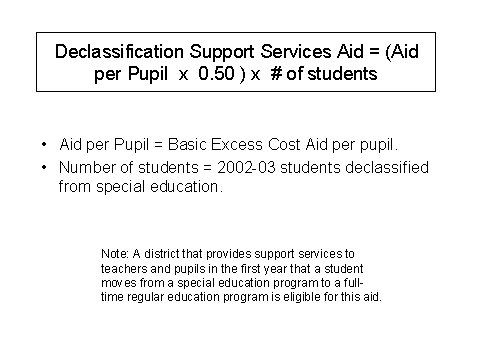
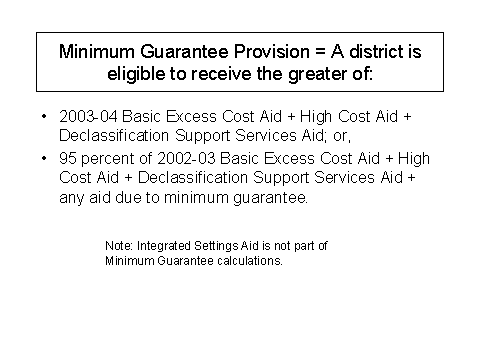
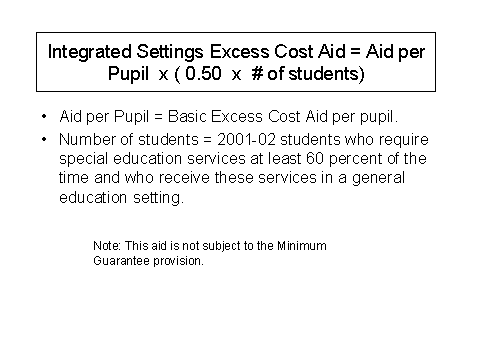
· Attachment D is a technical description of State Aids to help school districts with the costs of educating students with disabilities, provided for reference.
Attachments
Attachment
A
Providing Financial Support to Help
Students with
Disabilities Meet State Learning
Standards
This fall, the New York State Education Department will conduct a series of public meetings and meetings with educators throughout the State to obtain input on the best way to provide financial support to assist students with disabilities in meeting State learning standards. The results of those public meetings will be presented to the Regents at the October 2004 Regents meeting. As background, we are providing the Regents Subcommittee on State Aid with information on program and fiscal issues for students with disabilities in anticipation of the fall report.
State Education Department Visions and Goals
The State Education Department has set goals and its vision for the people and institutions that it serves. They are as follows:
1. All students will meet high standards for academic performance and personal behavior and demonstrate the knowledge and skills required by a dynamic world.
2. All educational institutions will meet Regents high performance standards.
3. The public will be served by qualified, ethical professionals who remain current with best practice in their fields and reflect the diversity of New York State.
4. Education, information and cultural resources will be available and accessible to all people.
5. Resources under our care will be used or maintained in the public interest.
6. Our work environment will meet high standards.
Program
Goals of the Office of Vocational and Educational Services for Individuals with
Disabilities (VESID)
VESID has established program goals for individuals with disabilities. These goals are consistent with the Department’s vision and goals for New York State residents. The VESID goals are as follows:
1. Students receiving special education services will meet high educational standards.
2. Students with disabilities will be integrated with their nondisabled peers throughout their educational experience.
3. Individuals with disabilities will participate successfully in post-secondary education.
4. Individuals with disabilities will be employed in integrated work settings.
5. All services for which VESID has responsibility will be cost-effective.
6. All services for which VESID has responsibility will meet high standards and continuously improve.
State Aid Goal and Principles
The goal of funding for students with disabilities is the same as the goal of funding for all students. As stated in the Regents proposal on State Aid to school districts for school year 2004-05, this goal is:
The State's system of funding for education
should provide adequate resources through a State and local partnership so that
all students have the opportunity to achieve the State’s learning standards,
including resources for extra time and help for students.
The decision to change funding for students with disabilities or to continue existing apportionments, should be driven by an overall goal and a set of State Aid principles. The Department used the following State Aid principles in developing the Regents school aid proposal which should be considered in addressing funding for students with disabilities:
1. Simplicity--Formulas should be simple and understandable.
2. Adequacy--Effective distribution across all districts will insure adequate resources for acceptable student achievement.
3. Sustainability--Resources are predictable and available consistently over time.
4. Flexibility--Allow districts to decide how to use resources most effectively.
5. Accountability--Measure outcomes and use those measures to insure that financial resources are used effectively.
6. Equity—Recognize differences in school districts’ fiscal capacity, pupil need and regional costs to maintain comparable levels of local effort in school districts across the State.
7. Efficiency--Promote efficiency in the distribution and use of aid.
It may not always be possible for each aid formula to address all of these principles. Some formulas may address one principle and infringe on another. The trade offs, when there is such a conflict, must be carefully evaluated so that State Aid works to support desired educational outcomes.
Current Issues In Special Education
Program Issues
In New York State, 42 percent of the pupils enrolled in special education are in large city school districts (New York City, Buffalo, Rochester, Syracuse and Yonkers). Thirty-six percent of New York State’s school-age students with disabilities live in New York City. In these districts, adequate support services in general education are limited, and there is a high percentage of families living in poverty. Historically, difficulty finding teachers resulted in greater numbers of uncertified teachers in new districts. The lack of resources makes it more difficult to provide quality instruction and early intervention for students in New York’s large, urban districts. This means there is a greater likelihood that these students will not have access to a rigorous general education curriculum, which results in lower performance on State assessments and less likelihood of meeting graduation requirements. The circumstances of large city districts pose a challenge for meeting VESID’s first goal that students receiving special education services will meet high educational standards.
Two reports to the Board of Regents on special education data (June 2002,
April 2003) focused on outcomes for students with disabilities and special
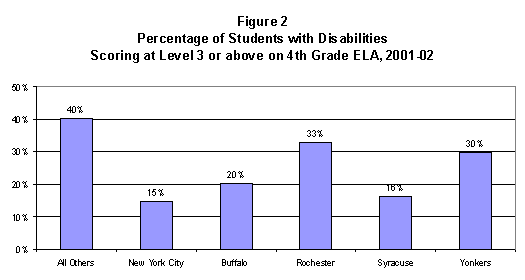
education placement patterns across New York State. The data (see Figures 1 and 2 for
illustrative examples) demonstrated that the placement and performance of
students with disabilities vary considerably based upon the needs and resources
of the district in which students reside.
In New York State, the largest number of racially and ethnically diverse
students are concentrated in high need school districts where adequate support
services in general education are limited, a greater number of teachers are
uncertified, and students with disabilities are more likely to be served in
restrictive special class placements.
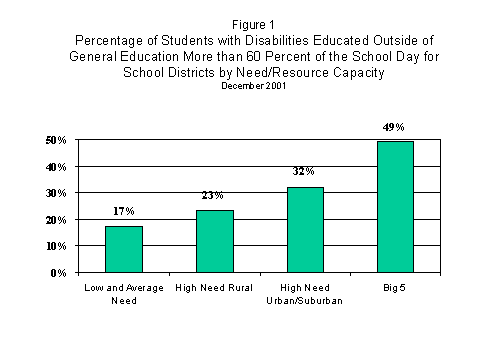
The variation in placement corresponds to a variation in student achievement. Achievement in the five largest cities is low compared with the rest of the State’s school districts. Figure 2 shows results for the Grade 4 English language arts examination. The trend it reveals is duplicated by other subjects and grade levels.
Fiscal
Issues
There has been a general perception that costs for the education of students with disabilities have been increasing. Historical data show that this was true for much of the last two decades of the twentieth century (see Table 1).
|
Table 1.
Allocation of the Real Increase in Education Expenditures in New York
State and City Between 1979-80 and 1992-93 | ||||
|
Expenditure category |
1980 share of total expenditure
(percent) |
1993 share of total expenditure
(percent) |
Real change in expenditure (in billions of
dollars) |
Share of real change
(percent) |
|
New York
State (excluding New York
City) | ||||
|
Teaching, regular |
53.1 |
48.8 |
1.07 |
33.3 |
|
Teaching, disabilities |
5.0 |
11.3 |
1.09 |
34.1 |
|
New York
City | ||||
|
Teaching, regular |
54.3 |
47.7 |
.56 |
28.5 |
|
Teaching, disabilities |
6.9 |
18.6 |
1.04 |
53.0 |
|
Source:
Excerpted from The
Allocation of Resources to Special Education and Regular Instruction,
H. Lankford and J. Wyckoff in Ladd, H.F. (ed.), Holding Schools
Accountable. Washington,
D.C. The Brookings
Institution, 1996, p. 229. | ||||
With the enactment of PL 94-142 in 1975, the Education for All Handicapped Children Act (currently the Individuals with Disabilities Education Act), school districts began to place a major focus on the education of students with disabilities. Table 1 shows that spending on special education as a percent of total education expenditures increased from 5 percent to 11.3 percent between 1980 and 1993 in New York State school districts. In New York City the increase was even more dramatic, from 6.9 percent to 18.6 percent of total expenditures. Table 1 shows that special education consumed significant portions of the increase in spending during these years.
These increases in spending corresponded to increases in the classification of students with disabilities throughout most of the 1990s, mirroring a national trend. However, in recent years the special education population appears to be holding steady at about 12 percent of enrollment.
Data on instructional costs per pupil, although limited to more recent years, show a rise in instructional costs and instructional costs per pupil (see Table 2).
Table 2
Special Education Cost Per Pupil Summary
|
Year |
Instructional
Costs (billions) |
Pupils |
Cost per
Pupil |
|
1995-96 |
$4.3 |
358,432 |
$12,122 |
|
1996-97 |
$4.5 |
376,769 |
$12,004 |
|
1997-98 |
$4.8 |
386,226 |
$12,673 |
|
1998-99 |
$5.3 |
394,640 |
$13,466 |
|
1999-2000 |
$5.7 |
396,331 |
$14,625 |
|
2000-01 |
$6.0 |
403,322 |
$14,979 |
|
2001-02 |
$6.2 |
400,696 |
$15,712 |
Instructional costs as a whole rose throughout this period. As shown in Table 3, special education instructional costs have remained about 24 percent of total instructional costs in recent years.
|
Table 3 K-12 Instructional
Costs | ||||
|
School
Year |
General
Education |
Special
Education |
Total |
%
Special |
|
2001-2002 |
$19,737,851,691 |
$6,295,608,262 |
$26,033,459,953 |
24.18% |
|
2000-2001 |
$19,119,327,401 |
$6,041,342,603 |
$25,160,670,004 |
24.01% |
|
1999-2000 |
$17,431,068,823 |
$5,796,524,263 |
$23,227,593,087 |
24.96% |
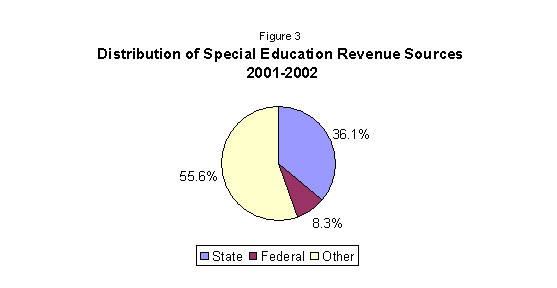
These costs are funded from three revenue sources: State, Federal and other (primarily local revenues). Figure 3 shows the distribution of revenue sources in support of special education in New York State.
State Aid to help districts with the costs of special education has also
grown Table 4 shows that aid for the excess costs of students with disabilities
educated in public schools and BOCES has grown more than 100 percent since
1992-93. Aid for students with disabilities educated in approved private special
education schools has grown 134 percent.
|
Table 4 Change in Excess Cost
Aid 1992-1993 to 2002-2003 | |||||
|
|
2002-03 |
2001-02* |
2000-01 |
1999-00 |
1992-93 |
|
Public Excess Cost Aid |
$2,136,924,823 |
$1,853,048,300 |
$1,859,588,890 |
$1,724,716,624 |
$1,051,715,175 |
|
incl. aid due save-harmless |
$44,545,937 |
N/A |
$60,543,386 |
$59,845,135 |
$17,101,689 |
|
5-Year % change from
92-93 |
103.2% |
|
|
|
|
|
Private Excess Cost Aid |
$184,713,315 |
$145,843,992 |
$144,614,528 |
$139,658,548 |
$78,750,416 |
|
5-Year % change from
92-93 |
134.6% |
|
|
|
|
|
*
2001-02 baseline budget did not allocate aids by formula. Amounts were set aside based on
Executive recommendations in computer run BT0321. Save-harmless aid was folded into
the baseline budget. | |||||
Current System of State Aid for Students with Disabilities
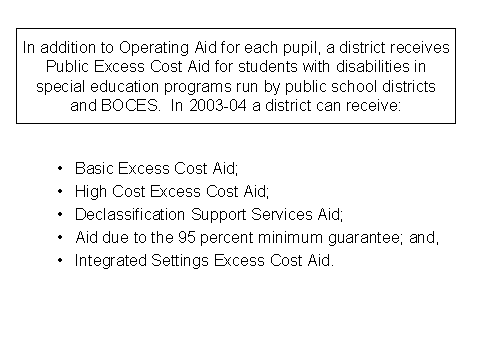
The current system for providing State Aid to school districts for students with disabilities is a categorical aid approach based on the classification of students with disabilities. In addition to Operating Aid for each pupil, a district receives Public Excess Cost Aid for students with disabilities in special education programs run by public school districts and BOCES. A district receives Private Excess Cost Aid for each student with a disability whose individualized education plan requires education in an approved private special education school. See Attachment B for a description of the calculation of State aids to help school districts with the cost of educating students with disabilities. These apportionments:
§ Provide aid for students with disabilities in public schools and BOCES based on the average spending on all students in the district;
§ Are wealth-equalized so that in general poorer school districts receive more aid and wealthier districts less;
§ Require a substantial local contribution from school districts;
§ Provide guaranteed minimum aid provisions so that even the wealthiest districts receive sizable amounts of aid (minimum aid ratios are 25 percent of aidable expenses[1] for Public Excess Cost Aid and 50 percent for Private Excess Cost Aid);
§ Provide extra reimbursement for the State’s highest cost students with disabilities;
§ Provide additional aid for certain students with disabilities receiving special education services in settings integrated with their non-disabled peers; and
§ Provide aid for one year to help school districts with extra support services for students declassified from special education.
The law that provides additional aid for students with
disabilities receiving special education in settings integrated with their
non-disabled peers (known as the Integrated Services weighting) is due to sunset
at the end of the 2003-04 school year.
This enhanced weighting was enacted as part of Chapter 405 of the Laws of
1999 in response to a concern from the Federal Department of Education that New
York State’s funding formula provided a financial incentive for placement of
students in more restrictive settings. The Board of Regents has recommended
continuation of this enhanced weighting for an additional year (through 2004-05)
as we obtain public input about revision to the State Aid formulas for students
with disabilities.
Additionally, though not considered aid for students with disabilities, Educationally Related Support Services Aid (ERSSA) is provided to school districts to provide support for students (not classified as students with disabilities) who need assistance in the general education setting to maintain their academic standing and avoid referral to special education. ERSSA is also provided for services to qualified pupils with disabilities under the Americans with Disabilities Act and any students with disabilities whose attendance does not generate any excess cost aid.
Aid for general education instruction is also provided through some 28 other aid programs, separate from excess cost aids for students with disabilities.
Discussion Questions
How can State funding best support the achievement of students with disabilities and placements in the least restrictive environment? The complexity of the current system (which requires categorizing students with disabilities by a level of special education service) has resulted in a variety of interpretations by school districts. This raises the question as to whether we could get the same or better results with a simplified system. Data on the achievement of students with disabilities and other students emphasize the interrelatedness of special and general education: that poor special education programs (and student results) are associated with poor general education programs and results. Thus, any strategy must necessarily address both general and special education programs. Nine states have blurred the line between special and general education programs by enacting census-based special education funding systems (see Attachment C).
We seek advice concerning the following discussion questions:
- Should aid for pupils with disabilities be categorical (i.e., specifically related to services for pupils with disabilities) or should it be general purpose aid, where services to pupils with disabilities are a component of Academic Intervention Services?
- For each of these alternatives (categorical or general purpose), should aid be based on actual placements of students with disabilities in special education or should it be based on social indicators related to the incidence of special needs within the overall student population?
- To what extent should funding for students with disabilities be related to accountability for results?
- Should there be a distinction in aid between:
- Public and private special education programs; and
- Regular and high cost placements?
- Should there be a financial incentive for integrating students with disabilities in general education programs?
- What is the best way to promote achievement gains for students with disabilities?
- Aid is available for students with disabilities of such a severity to require 12-month programming to prevent substantial regression over the summer months. Other students may need summer programs to obtain extra time and help in meeting State standards. Should the formulas provide additional aid for special education needs of students with disabilities in summer school programs if such students do not qualify for 12-month program aid?
- Do we fold special education aid into a foundation program for education instruction or keep it separate?
2004 Public Forums on Special Education
Funding
The tentative schedule and locations for the public meetings are as follows. Please note that if the State budget includes Excess Cost Aid in a foundation or operating aid formula for school year 2004-05, we will not conduct these sessions this fall.
New York City
September 27, 2004 5:00 - 7:00 p.m.
NYC DOE
52 Chambers St. (Tweed Court House)
New York, N. Y. 10007
Long Island
September 20, 2004 5:00 - 7:00 p.m.
Half Hollow Hills SD
High School East-Lecture Hall
50 Vanderbilt Parkway
Dix Hills, NY 11746
Rochester
September 23, 2004 5:00 – 7:00 p.m.
Monroe BOCES 2
3599 Big Ridge Road
Spencerport, NY 14559
Albany
September 21, 2004 5:00 – 7:00 p.m.
Mohonasen CSD
Media Center
2072 Curry Road
Schenectady, NY 12303
ATTACHMENT
B![]()
Special
Education Funding
State |
Basis of state special
education funding system (2003) |
State includes the
following in its special education funding formula
(2003) | ||||
|
District wealth or
fiscal capacity1 |
Student
poverty |
High-cost
students |
Caps or limitations on
revenue or percent of students eligible for state
funding |
Student
performance | ||
|
Alabama |
Census-based |
Yes |
No |
Yes |
No |
No |
|
Alaska |
Census-based |
No |
Yes |
Yes |
No |
No |
|
Arizona |
Pupil Weights --
Multiple |
Yes |
No |
No |
No |
No |
|
Arkansas |
Variable Block
Grant |
No |
No |
Yes |
No |
No |
|
California |
Census-based |
No |
No |
No |
No |
No |
|
Colorado |
Variable Block
Grant |
No |
No |
No |
No |
No |
|
Connecticut |
Census-based |
Yes |
Yes |
Yes |
No |
No |
|
Delaware |
Resource-based |
Yes |
No |
No |
No |
No |
|
District of
Columbia |
Pupil Weights --
Multiple |
No |
No |
No |
No |
No |
|
Florida |
Pupil Weights --
Multiple |
Yes |
No |
Yes |
Yes |
No |
|
Georgia |
Pupil Weights --
Multiple |
Yes |
No |
No |
No |
No |
|
Hawaii |
None |
No |
No |
No |
No |
No |
|
Idaho |
Census-based |
Yes |
No |
Yes |
Yes |
No |
|
Illinois |
Percentage
Reimbursement |
No |
No |
Yes |
No |
No |
|
Indiana |
Pupil Weights --
Tier |
No |
No |
No |
No |
No |
|
Iowa |
Pupil Weights --
Multiple |
Yes |
No |
No |
No |
No |
|
Kansas |
Resource-based |
No |
No |
Yes |
Yes |
No |
|
Kentucky |
Pupil Weights --
Multiple |
Yes |
No |
No |
No |
No |
|
Louisiana |
Pupil Weight --
Single |
Yes |
Yes |
No |
No |
No |
|
Maine |
Percentage
Reimbursement |
Yes |
No |
No |
No |
No |
|
Maryland |
Combination |
Yes |
No |
Yes |
No |
No |
|
Massachusetts |
Census-based |
Yes |
Yes |
Yes |
Yes |
No |
|
Michigan |
Percentage
Reimbursement |
Yes |
No |
No |
No |
No |
|
Minnesota |
Variable Block
Grant |
No |
No |
Yes |
Yes |
No |
|
Mississippi |
Resource-based |
No |
No |
No |
No |
No |
|
Missouri |
Combination |
No |
Yes |
Yes |
No |
No |
|
Montana |
Census-based |
Yes |
No |
No |
No |
No |
|
Nebraska |
Percentage
Reimbursement |
No |
No |
No |
Yes |
No |
|
Nevada |
Resource-based |
Yes |
No |
No |
Yes |
No |
|
New
Hampshire |
Pupil Weight --
Single |
No |
Yes |
Yes |
No |
No |
|
New
Jersey |
Pupil Weights --
Tier |
No |
No |
Yes |
Yes |
No |
|
New
Mexico |
Combination |
No |
Yes |
No |
No |
No |
|
New
York |
Pupil Weights --
Multiple |
Yes |
No |
Yes |
No |
No |
|
North
Carolina |
Flat
Grant |
No |
No |
No |
Yes |
No |
|
North
Dakota |
Census-based |
No |
No |
Yes |
Yes |
No |
|
Ohio |
Pupil Weights --
Multiple |
Yes |
Yes |
Yes |
No |
No |
|
Oklahoma |
Pupil Weights --
Multiple |
Yes |
Yes |
Yes |
No |
No |
|
Oregon |
Pupil Weight --
Single |
No |
Yes |
Yes |
Yes |
No |
|
Pennsylvania |
Census-based |
Yes |
Yes |
Yes |
No |
No |
|
Rhode
Island |
None |
No |
No |
No |
No |
No |
|
South
Carolina |
Pupil Weights --
Multiple |
Yes |
No |
No |
No |
No |
|
South
Dakota |
Combination |
Yes |
No |
No |
No |
No |
|
Tennessee |
Resource-based |
No |
No |
No |
No |
No |
|
Texas |
Pupil Weights --
Multiple |
Yes |
No |
No |
No |
No |
|
Utah |
Variable Block
Grant |
No |
No |
Yes |
Yes |
No |
|
Vermont |
Combination |
No |
No |
Yes |
Yes |
No |
|
Virginia |
Resource-based |
Yes |
No |
No |
No |
No |
|
Washington |
Pupil Weights --
Multiple |
No |
No |
Yes |
Yes |
No |
|
West
Virginia |
Pupil Weight --
Single |
Yes |
No |
No |
Yes |
No |
|
Wisconsin |
Percentage
Reimbursement |
No |
No |
No |
Yes |
No |
|
Wyoming |
Percentage
Reimbursement |
Yes |
No |
No |
No |
No |
|
United States |
|
26 |
11 |
23 |
16 |
0 |
SOURCE: Education Week annual state policy
survey, 2003.
1 For all
states other than Maine, Maryland, Montana, Pennsylvania, and South Dakota,
provisions for special education funding and adjustments for district wealth
are
both included in the regular
education formula.
ATTACHMENT
C![]()
Schedule of Reports and
Topics
Development of the Regents
Proposal on State Aid
to School Districts for
School Year 2005-06
Subcommittee on State Aid
|
Date |
Reports/Topics |
|
May 2004 |
Special education funding Schedule of reports for developing the 2005-06 proposal |
|
June 2004 |
Update on State budget (as available) Reaffirm proposal goals Education Finance Research Consortium: Synthesis of school finance symposium and update on Consortium |
|
July 2004 |
Compressed meeting (no item on State Aid) |
|
September 2004 |
Assessing Progress: Reviewing legislative action in comparison with proposals (Regents, CFE, Zarb, etc.) Proposal introduction or outline Primer presentation on State Aid |
|
October 2004 |
Meeting of Education Finance Advisory Group |
|
October 2004 |
Update on local effort in support of education Review proposal directions Report on focus forums on special education funding |
|
November 2004 |
Meeting of Education Finance Advisory Group |
|
November 2004 |
Review draft of conceptual proposal |
|
December 2004 |
Action on final proposal with the dollar amount recommended and the overall distribution of aid |
|
January 2005 – April 2005 |
Legislative advocacy |

