Meeting of the Board of Regents | September 2003
Assessing Progress
Five Years of Regents School Aid Proposals
and Legislative Action
Discussion Materials
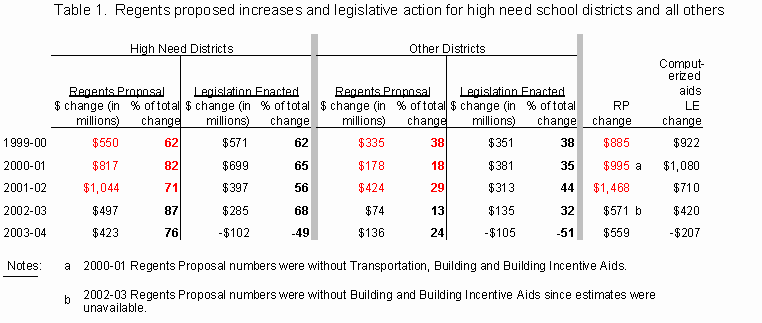
The Regents have emphasized the importance of targeting more resources to high need school districts to assist them in closing the student achievement gap. Table 1 shows the amount and percent of the increase in aid that the Regents recommended for high need school districts in each of the past five years. It shows the amount and percent of the increase that the State enacted each year as well.

Table 1 shows that the Regents have consistently recommended that the majority of the aid increase be targeted to high need school districts and the Legislature has responded in kind. The exception to this is for the 2003-04 school year, when the State budget deficit resulted in a decrease of $207 million for school districts. In the case of a cut, it is more advantageous to have a lower percentage share. High need and other school districts split the cut almost equally with 49 percent of the cut borne by high need school districts.
Table 2 shows over the past five years, the percent and dollar change in aid for each category of aid. Six aids accounted for 90 percent of the increased school aid during this period: Comprehensive Operating Aid, Public Excess Cost Aid for the education of students with disabilities in public schools and BOCES, school Transportation Aid, Building Aid for school construction, Universal Pre-kindergarten grants (including a reserve fund to allow school districts to draw on these funds as needed), and BOCES Aid for school district shared services.
Table 2. Where the Money Went: 1999-00 to 2003-04
|
Aid Category |
Percent Change |
$ Change |
|
Biggest Dollar Increase: |
||
|
(Comprehensive) Operating |
||
|
Tax Effort |
||
|
Tax Equalization |
||
|
Transition Adj Positive |
||
|
Transition Adj Negative |
||
|
Gifted/Talented |
||
|
Operating Standards |
||
|
Academic Support |
||
|
Sum of Above Aids |
7.1% |
455,132,470 |
|
Excess Cost-Public |
25.1% |
432,847,717 |
|
Transportation |
35.0% |
282,237,045 |
|
Building |
28.9% |
268,537,091 |
|
LADDER Aids: |
||
|
Univ Pre-K Grant Incl Reserve |
145.0% |
121,138,278 |
|
Class Size Reduction Grant |
92.0% |
67,054,871 |
|
Textbook |
23.9% |
36,635,648 |
|
Software |
106.9% |
23,809,583 |
|
Hardware |
56.2% |
10,198,215 |
|
Tax Limitation Aid |
19.8% |
4,955,267 |
|
Maintenance/Repair Aid |
0.0% |
7,340 |
|
Full Day K Conversion |
-8.1% |
-560,509 |
|
Shared Services-Non-Component |
-100.0% |
-9,999,920 |
|
Instructional Computer Technology |
-100.0% |
-25,242,995 |
|
GAP Aids: |
||
|
Extraordinary Needs |
5.9% |
39,076,247 |
|
Summer School Program |
na |
36,513,207 |
|
Limited English Proficiency |
27.5% |
18,669,401 |
|
Supporting Students with Disabilities: |
||
|
Excess Cost-Private |
36.6% |
51,164,245 |
|
Educationally Related Support Services |
10.3% |
6,767,382 |
|
BOCES/Career and Technical Education: |
||
|
BOCES |
23.0% |
97,598,756 |
|
SS-Computer Administration |
-3.8% |
-1,505,103 |
|
SS-Career Education |
-13.4% |
-13,079,838 |
|
Other Aids: |
||
|
Summer Transportation |
na |
4,999,894 |
|
Building Aid/Capital Outlay Trnstn Grant |
na |
3,466,221 |
|
Library Materials |
4.6% |
847,197 |
|
Teacher Support Aid |
0.0% |
0 |
|
Small Cities Aid |
0.0% |
0 |
|
Growth |
-10.4% |
-3,352,517 |
|
Reorg Incentive - Bldg |
-23.7% |
-4,055,736 |
|
Reorg Incentive - Oper |
-31.1% |
-7,912,637 |
|
Grants: |
||
|
Small Cities Grant |
na |
0 |
|
AI/DP Grant |
-100.0% |
-757,100 |
|
Categorical Reading Grant |
0.0% |
0 |
|
Magnet School Grant |
0.5% |
678,000 |
|
IPP Grant |
0.0% |
0 |
|
Fort Drum Grant |
0.0% |
0 |
|
SUBTOTAL: |
15.4% |
1,895,867,720 |
|
Rescue II Aid - $50 m |
na |
|
|
Rescue I Aid - $145 m |
na |
|
|
Transition Grant - DASNY |
na |
|
|
TOTAL: |
14.9% |
1,847,555,966 |


